为了组会临时写了个画三维网格的脚本
这周的组会打算汇报下KMCLib的思想,但是直接这么讲担心下面的同学和老师听不懂就特地写了个脚本画出三位网格图,以方便解释lattice模型。
这次组会之所以汇报KMCLib的原理,其中一个重要的原因是我想趁这个机会把看得东西进行总结,以免以后忘记了能够拿回来PPT快速回忆起来重要的东西。所以为了能够让下面的人听懂我在讲什么特地用python写了个绘制三维网格图的脚本,帮我节省了不少时间。不多扯了,进入主题吧。
三维网格主要是用来描述三维晶格的,因为KMCLib是一个可以模拟一维到三维的KMC模拟库,因此想要绘制三维图还是要结束matplotlib库的plot3d。同时还要配合着python的itertools提供的product和combinations函数,方便坐标的操作。
先倒入要用的库,然后创建figure对象和axes对象:
1 | # -*- coding: utf-8 -*- |
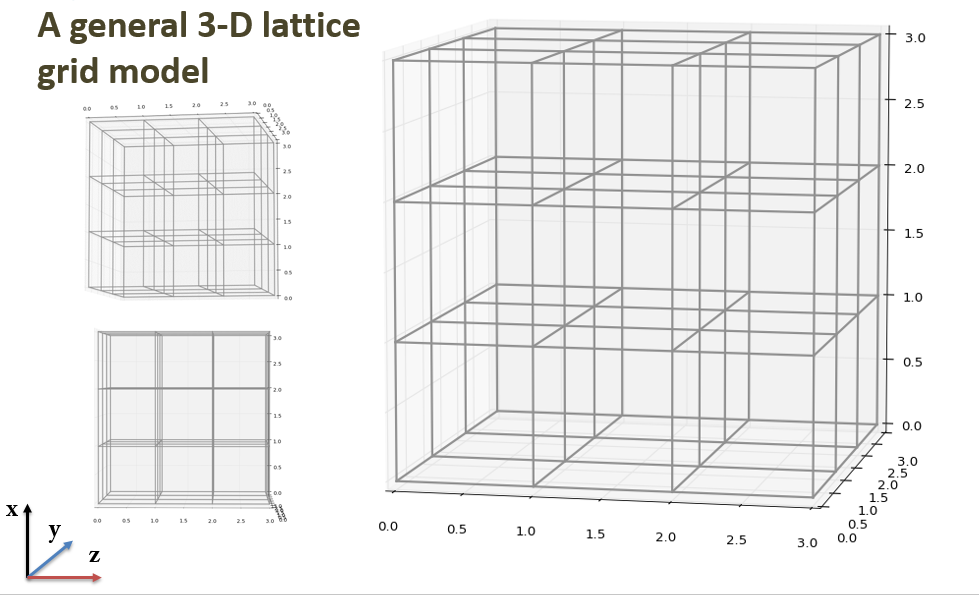
三维网格格点与线
网格主要是要画线,就是直接画三维直线即可(一下均用4x4x4的网格举例)。1
2
3
4
5
6
7
8
9
10
11
12
13
14
15
16
17r = range(0, 4)
# line width
lw = 1
# line color
lc = '#919191'
# get all position in a 2d plane
coordinates = product(r, repeat=2)
# draw line parallel to x axis
x = (r[0], r[-1])
for y, z in coordinates:
ax.plot3D(x, [y, y], [z, z], color=lc, lw=lw)
ax.plot3D([y, y], x, [z, z], color=lc, lw=lw)
ax.plot3D([y, y], [z, z], x, color=lc, lw=lw)
接下来就是要往网格个点上进行填充,这要先获取每个网格的每个坐标值,这时候就用到了itertools提供的接口了, 同时为了后面方便我把所有的坐标tuple保存了下来:1
2
3
4
5
6# get all points coordinates
coord_it = product(r, repeat=3)
# collect all points
coords = []
for c in coord_it:
coords.append(c)
三维散点进行填充
接下来要是使用三维散点往晶格上撒点,有了坐标了,这种撒点就很容易操作了,上效果图: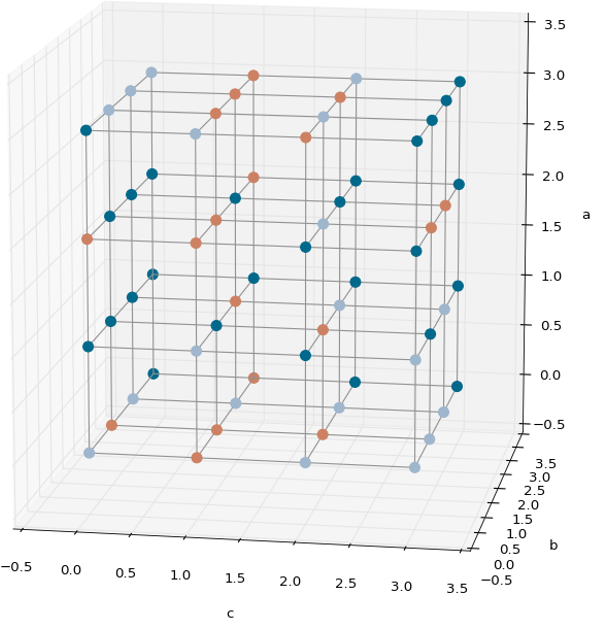
给晶格添加坐标
一开始我想用annotate来实现不过好像不用,ax.text()就很好,方便快捷:1
2
3
4
5
6
7
8# add text
for i, (x, y, z) in enumerate(coords):
ax.text(z, y, x, '%s' % (str(i)), size=13
add coordinates
for z, y, x in coords:
ax.text(x, y, z,
"(%s, %s, %s)" % (float(z), float
size=13, zorder=2, color='k')
效果图: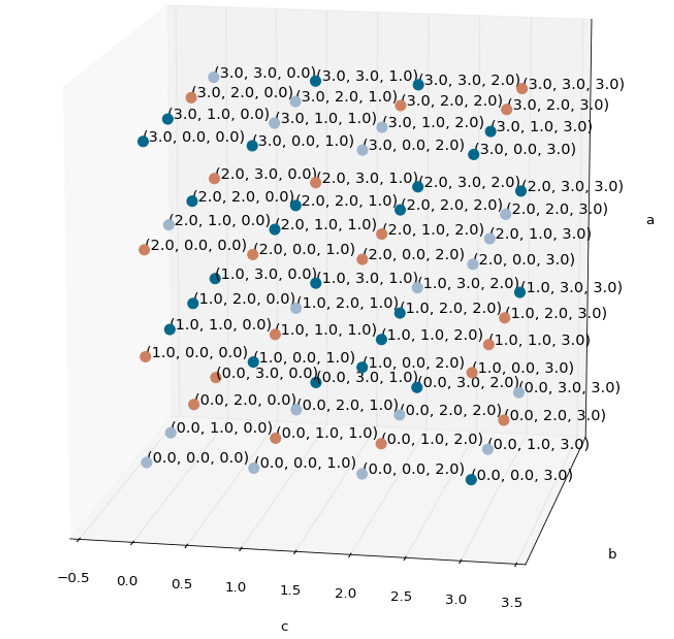
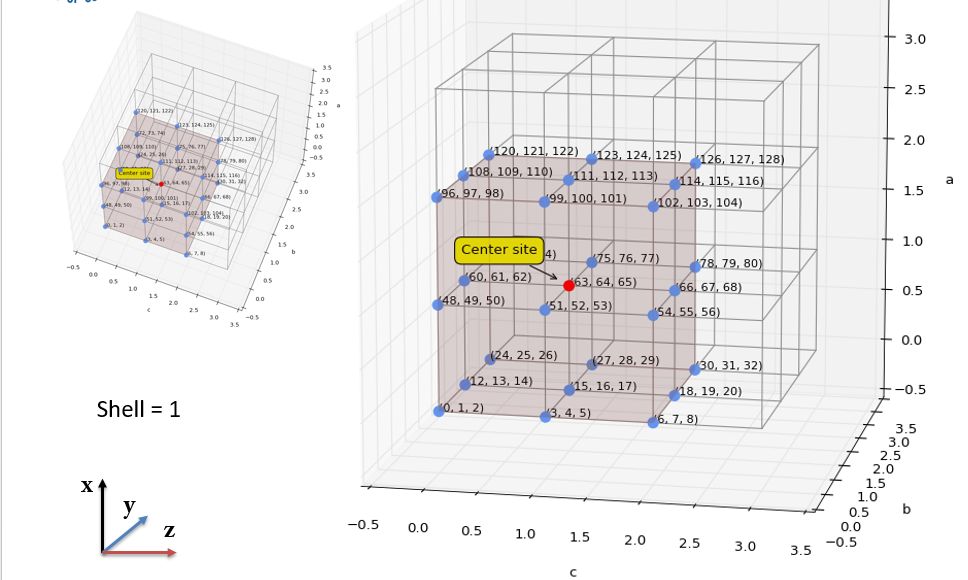
添加含有basis site的全局索引值
由于KMCLib中一个很重要的概念就是basis_site因为他的存在,是的kmclib足够强大能够模拟任何晶格的kMC过程,所以要实现能够画出这种效果的程序也很简单,把所有的点全部标号,只不过标号的时候要进行分组,这里就要用的数组的变形的,即numpy.array的reshape成员函数。1
2
3
4
5
6
7
8
9# add basis sites
nbasis = 3
site_indices = np.array(range(len(coords)*nbasis)).reshape(-1, nbasis)
site_indices = site_indices.tolist()
for basis_sites, position in zip(site_indices, coords):
x, y, z = position
bsite_str = ("(" + "%s, "*(nbasis-1) + "%s)") % tuple(map(str, ba
ax.text(z, y, x, bsite_str, size=10, zorder=2, color='k')
效果图: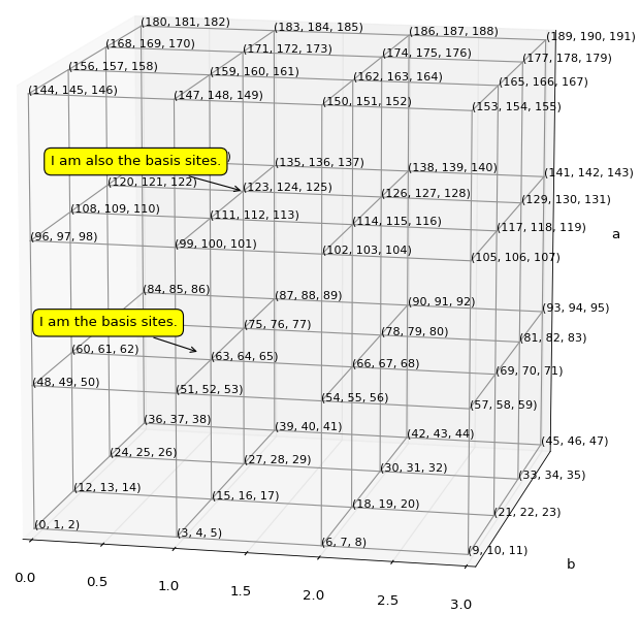
关于注释部分我是在stackoverflow上看到有人这么写我也就搬过来了:1
2
3
4
5
6
7
8
9
10
11
12
13# add annotate
x2, y2, _ = proj3d.proj_transform(1, 1, 1, ax.get_proj())
label = ax.annotate(
"Center site",
xy = (x2, y2), xytext = (-20, 20),
textcoords = 'offset points', ha = 'right', va = 'bottom',
bbox = dict(boxstyle = 'round,pad=0.5', fc = 'yellow', alpha = 1.0),
arrowprops = dict(arrowstyle = '->', connectionstyle = 'arc3,rad=0'))
def update_position(e):
x2, y2, _ = proj3d.proj_transform(1, 1, 1, ax.get_proj())
label.xy = x2,y2
label.update_positions(fig.canvas.renderer)
fig.canvas.draw()
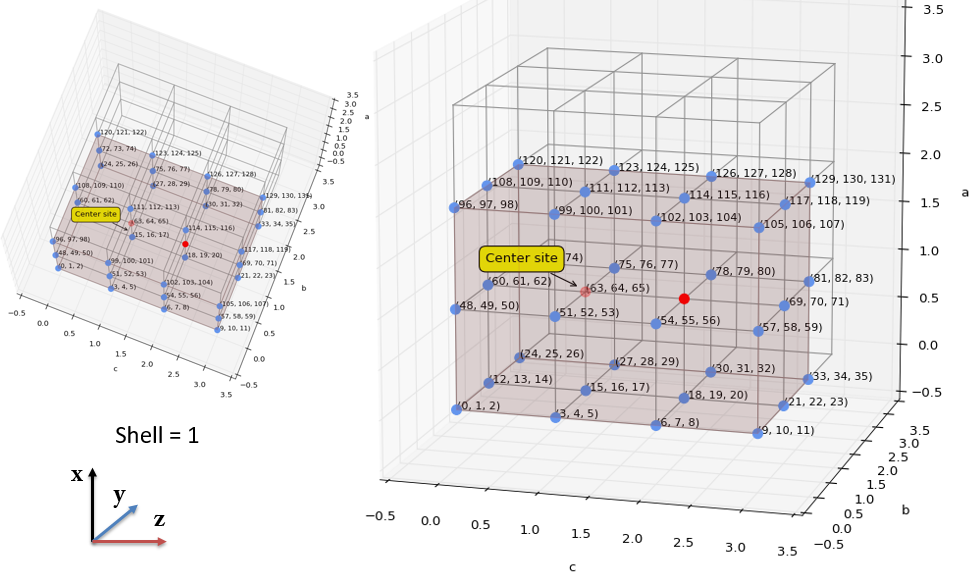
向还有多个basis site的网格填充散点
这里就要获取每个basis site的绝对坐标,获取方法就是在每个网格点上进行偏移处理,然后撒点。1
2
3
4
5
6
7
8
9
10
11
12
13
14
15
16
17
18
19
20
21
22# cadd additional points
offset_1 = (0., 0., 0.1)
offset_2 = (0., 0., 0.2)
for x, y, z in coords:
# if 3 in (x, y, z):
# continue
new_x = x + offset_1[0]
new_y = y + offset_1[1]
new_z = z + offset_1[2]
color = colors[int(random.random()*3)]
ax.scatter(new_x, new_y, new_z, color=color, s=80, marker='o')
# plot linking line
ax.plot3D((x, new_x), (y, new_y), (z, new_z), color=lc, lw=lw)
new_x = x + offset_2[0]
new_y = y + offset_2[1]
new_z = z + offset_2[2]
color = colors[int(random.random()*3)]
ax.scatter(new_x, new_y, new_z, color=color, s=80, marker='o')
# plot linking line
ax.plot3D((x, new_x), (y, new_y), (z, new_z), color=lc, lw=lw)
效果图: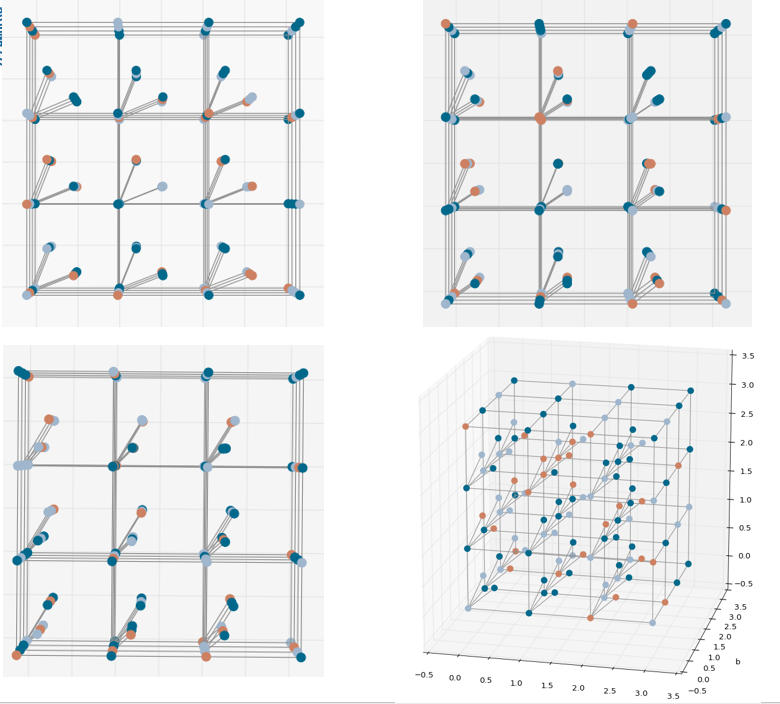
其他
由于还有要画一些封闭的面,这里就是直接使用plot_surface来画的,不多讲了,直接上图吧: